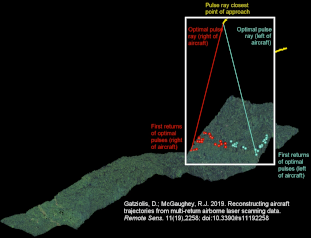
Reconstructing aircraft trajectories from multi-return airborne saser-scanning data.
Details in
Gatziolis and McGaughey, 2019
 (1.9 MB)
A LiDAR data set is initially reorganized into individual scan swaths. Each swath is split into successive,
few second-long chunks of returns. A pair of strategically selected multi-return pulses, usually positioned
on opposite end of the chunk, is identified and the 3D line the corresponding pulses propagate along is
calculated. The nearest point of approach between the two pulse lines provides an estimate of the location
of the scanning platform. A smooth spline fit to individual platform location estimates retrieves the true
platform trajectory with time. Testing across multiple forested biomes and laser acquisition specifications
showed that this methodology calculates the location of the laser instrument with submeter precision. It can
be used to retrieve the instrument's location for laser acquisition deliveries that do not include it.
(1.9 MB)
A LiDAR data set is initially reorganized into individual scan swaths. Each swath is split into successive,
few second-long chunks of returns. A pair of strategically selected multi-return pulses, usually positioned
on opposite end of the chunk, is identified and the 3D line the corresponding pulses propagate along is
calculated. The nearest point of approach between the two pulse lines provides an estimate of the location
of the scanning platform. A smooth spline fit to individual platform location estimates retrieves the true
platform trajectory with time. Testing across multiple forested biomes and laser acquisition specifications
showed that this methodology calculates the location of the laser instrument with submeter precision. It can
be used to retrieve the instrument's location for laser acquisition deliveries that do not include it.
 (30.0 MB
medium quality, or
147.4 MB high quality,
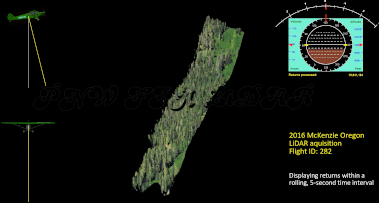
duration 5m34s). I suggest you view in full screen. As seen in the preview
to the left, this animation provides a rolling 5-second view of LiDAR returns from a single scan swath, while
showing a heads-up-display, and the pitch and roll of the aircraft as recorded during the flight.
(30.0 MB
medium quality, or
147.4 MB high quality,
duration 5m34s). I suggest you view in full screen. As seen in the preview
to the left, this animation provides a rolling 5-second view of LiDAR returns from a single scan swath, while
showing a heads-up-display, and the pitch and roll of the aircraft as recorded during the flight.
The animation documents the effects aircraft attitude have on local return density. When the aircraft pitch decreases rapidly (diving), the forward progression of the scan line is reversed. After the aircraft starts ascending again, the forward progression of the scan line is resumed at an accelerated pace. A clear demonstration of this phenomenon starts at 1m39s. In response to attitude changes, the 5-second portions shown in the animation can often be much narrower or wider than nominal. Note also that the low speed of many propeller aircraft necessitates a nearly constant positive pitch to maintain adequate lift. Unless the onboard laser instrument is gyrostabilized, there would be substantial discrepancy between recorded scan angles (that are independent of aircraft attitude) and true view angle. These discrepancies are known to bias estimates of canopy cover, gap fraction, etc. computed using the laser data. |
|||||||||||||
|
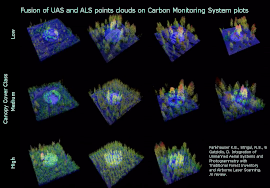
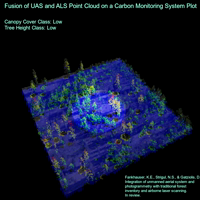
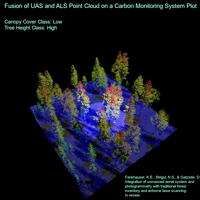
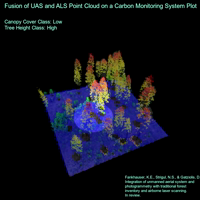
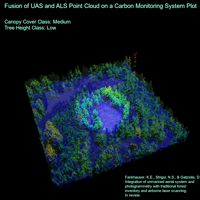
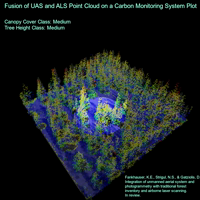
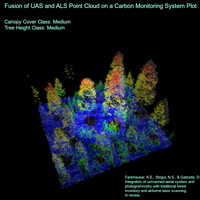
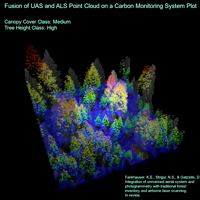
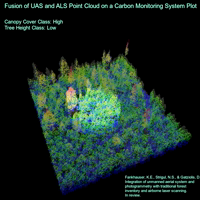
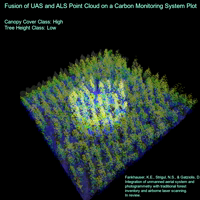
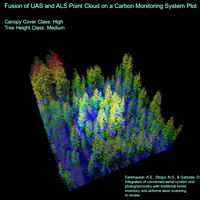
Integration of LiDAR- and UAS photogrammetry-derived point clouds for forest inventory plots.
Demonstrates the feasibility of very precise co-registration between LiDAR and UAS-derived point clouds achieved by distributing a network of ground markers prior to the UAS flight and measuring with centimeter precision the pairwise distances between them and corresponding ground slopes. The LiDAR point cloud is sparser, with near-ground returns in blue color and progressively warmer tones for higher ones. The UAS point cloud is displayed in natural color (panchromatic). Returns pertaining to the actual plot are within the 'spotlight' area. Details in Fankhauser et al., 2018
| |||||||||||||
UAS-photogrammetry-based estimation of tree dimensionality. Details in
Gatziolis et al., 2015.
 (13.0 MB)
This study demonstrated how inexpensive unmanned aerial systems (UASs) equipped with off-the-shelf cameras
can be used to capture lateral images of tree crowns, by, for example, descending into canopy openings or
moving around individual trees. By avoiding occlusion, such arrangements are often the only alternative for
comprehensive descriptions of lower crown components or for quantifying branch structure at leaf-on
conditions. Descending into canopy openings can now be accomplished easily and safely thanks to the obstacle
avoidance and collision protection offered by modern UAS. These capabilities were not available during our
study and we had to improvise to achieve our goal.
(13.0 MB)
This study demonstrated how inexpensive unmanned aerial systems (UASs) equipped with off-the-shelf cameras
can be used to capture lateral images of tree crowns, by, for example, descending into canopy openings or
moving around individual trees. By avoiding occlusion, such arrangements are often the only alternative for
comprehensive descriptions of lower crown components or for quantifying branch structure at leaf-on
conditions. Descending into canopy openings can now be accomplished easily and safely thanks to the obstacle
avoidance and collision protection offered by modern UAS. These capabilities were not available during our
study and we had to improvise to achieve our goal.
Note the 'frosting' evident at the top of the tree. It occurred because of the placement of the UAS at about 2/3rds of the tree height, with the camera axis being nearly horizontal. With this arrangement, approximately 1/5th of the upper part of the crown had the sky as background. Pixels depicting the crown top had RGB digital number above 225 at 8-bit quantization and appeared nearly white. All photogrammetry software we tried at the time mistakenly considered the top of the tree as background and failed to represent it in the resulting point clouds. Thanks, however, to customized pre-processing of the UAS imagery we managed to obtain complete tree representations. The same phenomenon, but less pronounced, affected the edges of lower branches which were mistaken as part of the ground when using the original UAS imagery. Those appear colored orange in the animation. |